

Published at 409 × 437 in Análise Estatística dos Mapas de Nascimento de ‘Serial Killers’
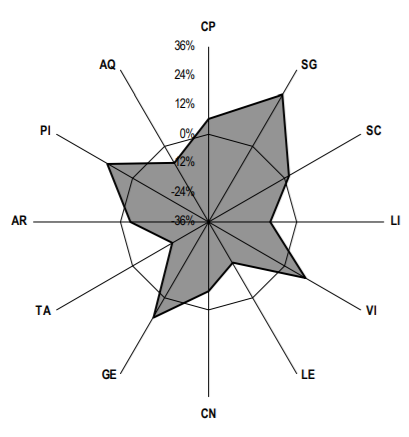
Figure9. Totals of eight factors per sign (Σ SO,MO,ME,VE,MA,JU,SA,AS) for the whole sample of293 serialkillers, radar-plotted as weighted deviation from the theoretically expected values derived from the control group (Ctrl1) of 6000 persons.


